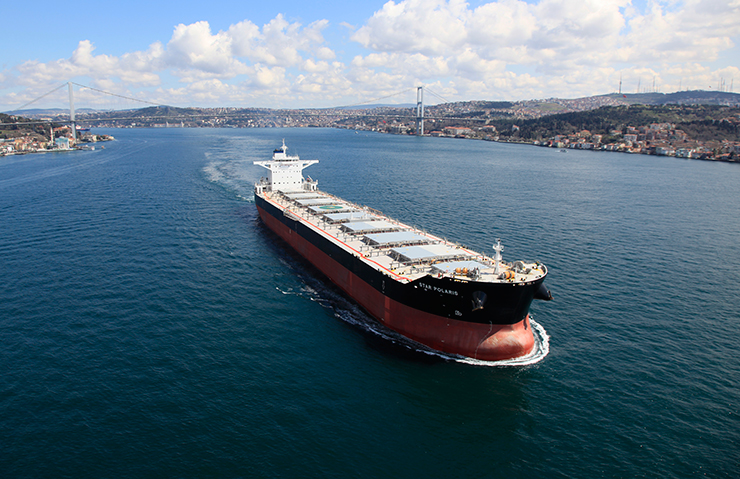
 点击添加图片描述(最多60个字)
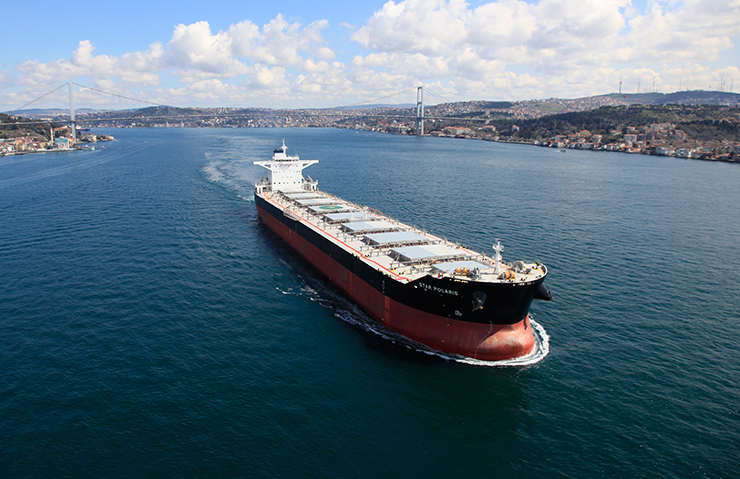
在美国上市的全球著名散货船运输公司Star Bulk Carriers Corp.宣布了其截至2019年9月30日的第三季度和9个月未经审计的财务和经营业绩。Star Bulk首席执行官Petros Pappas表示:

针对全球船用脱硫洗涤塔热和船舶技术的应用现状和发展趋势,更大规模、更高规格的“第三届2019国际船用洗涤塔和压载水系统产业上海峰会 ”暨“第六届2019船舶新技术与投资上海国际峰会”定于2019年11月30日-12月1日将在上海市华美达大酒店举办 。届时将有超过300多位来自中国、英国、美国、加拿大、德国、丹麦、挪威、瑞典、日本、法国、荷兰、比利时、芬兰、新加坡、马来西亚、韩国等国的船东、船厂、洗涤塔厂商、压载水厂商、配套厂家、设计和投资单位等参加,汇聚上海,在12月3-6日的上海国际海事展前3天,交流、探讨和分享全球限硫令下新技术应用等的机会、挑战、合作等。
报名邮件:chinabobli@126.com 或者 china@ishipoffshore.com

峰会很高兴目前已邀请到50多位著名中外船东嘉宾,其中香港华光海运集团新船部技术总监程红女士和中波轮船公司新船部技术经理郑庆国先生等,他们将以多年航运业造船的经历,在峰会上以“船东谈新技术产品应用和船舶市场发展趋势”为主题,分享和交流行业发展体会。当今热门的脱硫洗涤塔、压载水处理系统、LNG装备、低硫油切换、智能装备和其他新技术产品应用的发展案例、机会和趋势,将会峰会上分享交流、探讨。多位船东将分享洗涤塔压载水LNG装备等热点话题。
欢迎感兴趣单位尽快报名和咨询。
报名邮件: chinabobli@126.com 或者 china@ishipoffshore.com
报名参会流程见如下链接:
http://www.ishipoffshore.com/html/4/30/2019-10-23/9992.htm
中外嘉宾代表们在论坛成功举办的部分风采链接如下:
http://www.ishipoffshore.com/html/1/2019-06-20/9557.htm
http://www.ishipoffshore.com/html/1/2019-01-17/8733.htm
http://www.ishipoffshore.com/html/8/2019-09-14/9873.htm
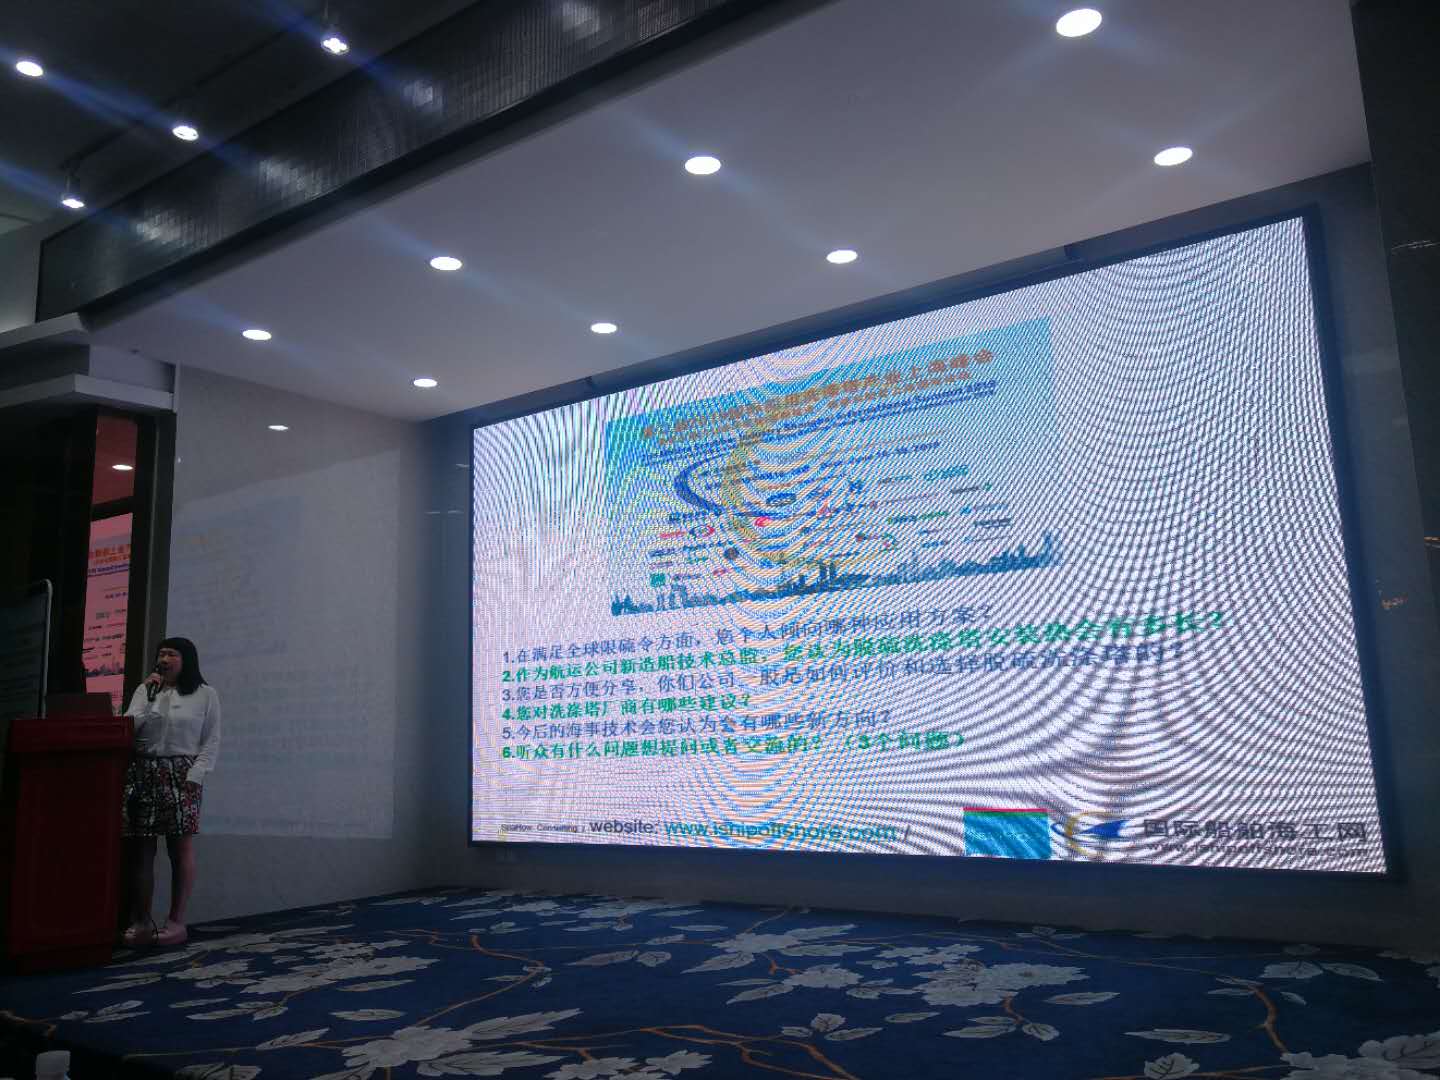
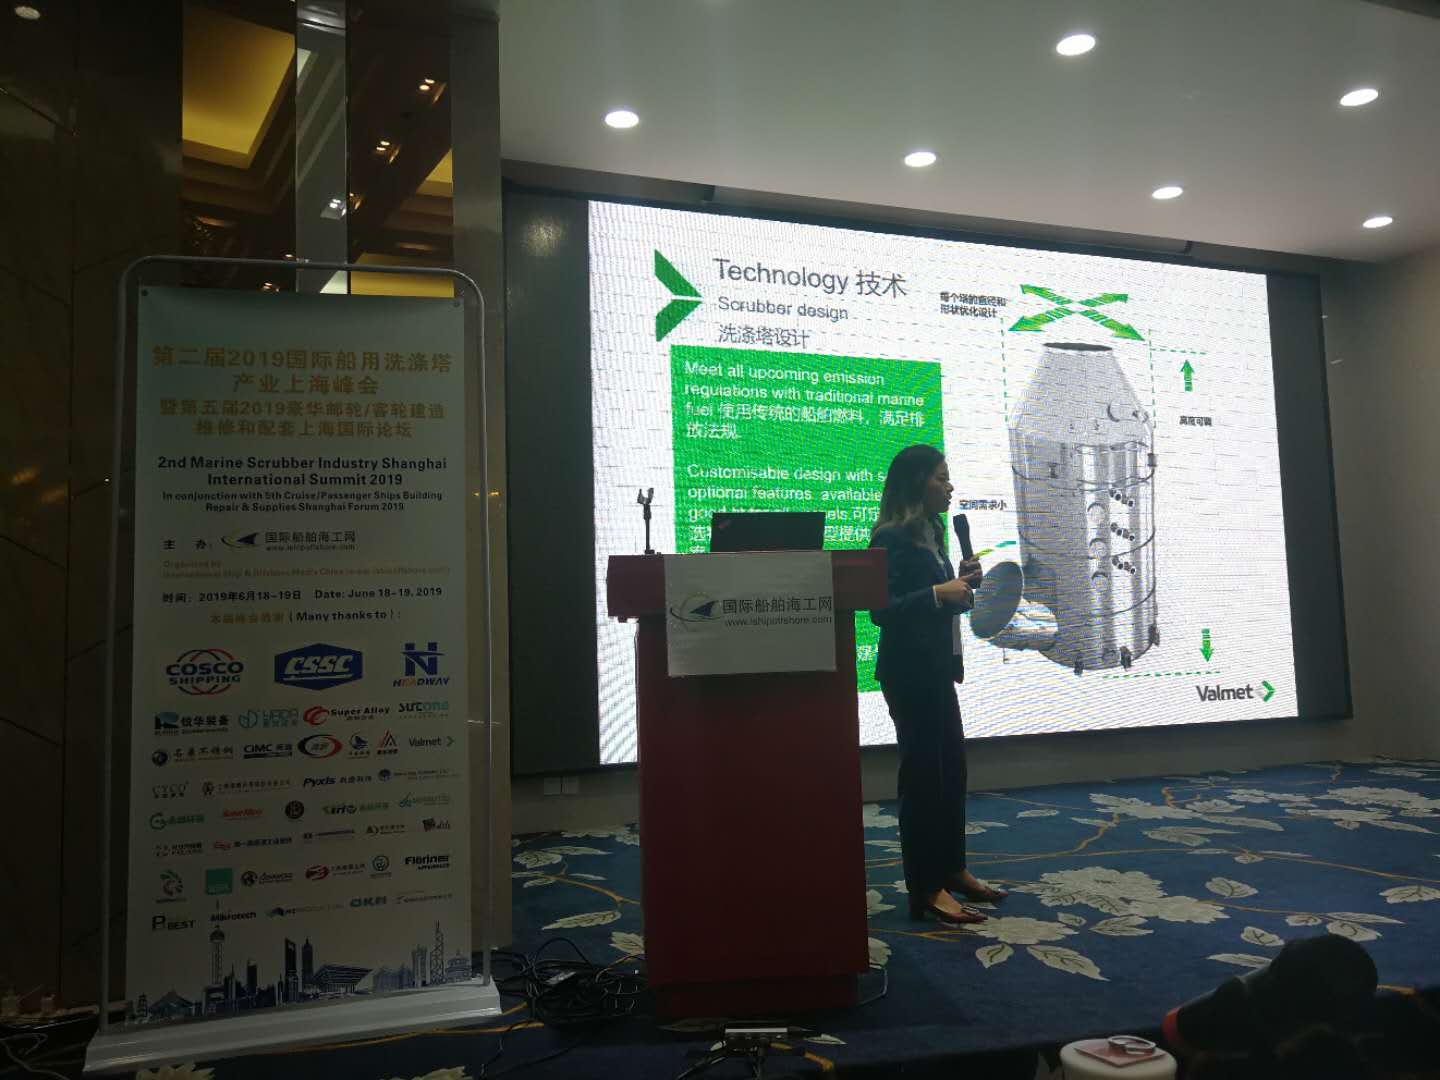
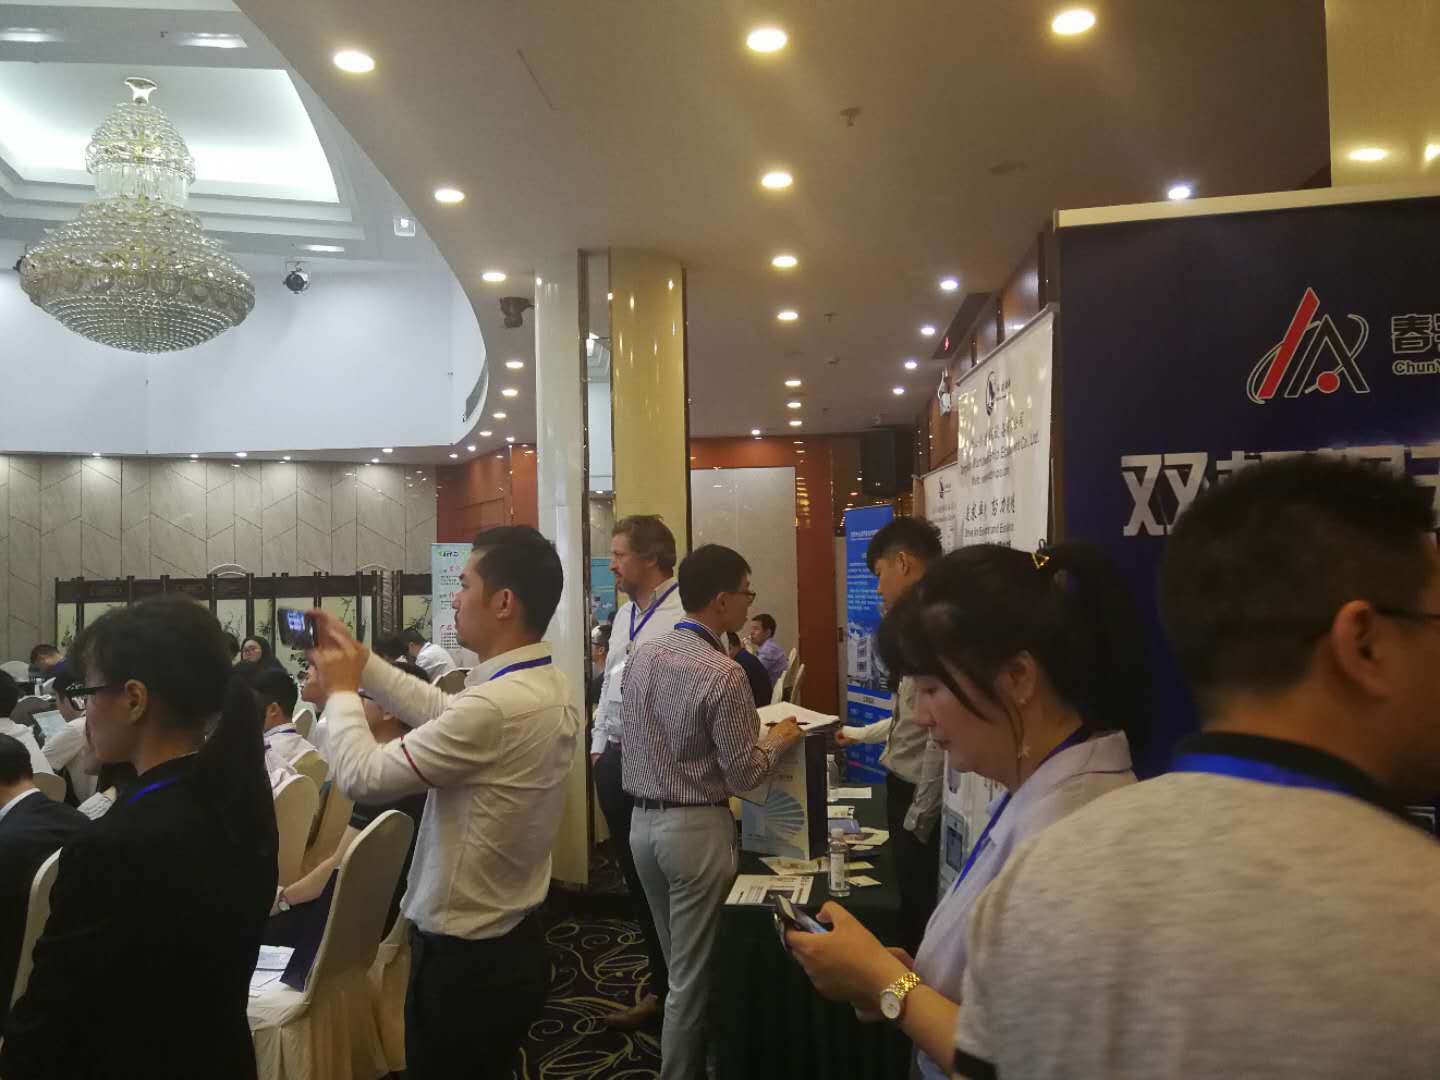
在2019年6月18日-19日,成功举办“第二届2019国际船用脱硫洗涤塔上海国际峰会 ”部分精彩演讲和交流图片如上和如下:


Star Bulk Carriers Corp. Reports $5.8 Million Net Profit for the Third Quarter 2019
Star Bulk Carriers Corp., a global shipping company focusing on the transportation of dry bulk cargoes, announced its unaudited financial and operating results for the third quarter and the nine months ended September 30, 2019.

Petros Pappas, Chief Executive Officer of Star Bulk, commented:
“Star Bulk returned to profitability during the third quarter 2019, reporting TCE Revenues of $131.3 million, Adjusted EBITDA of $72.2 million and a Net Profit of $5.8 million. The average TCE increased to $14,688/ day per vessel despite our fleet being affected by the repositioning to the Pacific due to our scrubber installation program. Daily Opex and Net Cash G&A expenses per vessel were reduced to $3,693/day and $828/day respectively.
We continued making significant progress in executing our scrubber retrofit program, having installed 88 towers, 50 of which are certified as of today. We are expecting to complete the certification process for the vast majority of our vessels by the end of the year aiming to realize commercial and operational benefits from the scrubber investment.
On the basis of the above results and our scrubber investment, we are pleased to announce a cash dividend for the quarter of $0.05 per share. We are also establishing a transparent dividend policy, under which the Company will distribute dividends once our cash balance has reached set thresholds. We believe the policy safeguards our strong balance sheet, whilst creating value by returning cash to our shareholders.”
Declaration of Dividend
• The Company’s Board of Directors (the “Board”) declared a quarterly cash dividend of $0.05 per share on November 20, 2019, payable on or about December 16, 2019, to all shareholders of record as of December 2, 2019 (“Record Date”). The ex-dividend date is expected to be November 29, 2019.
Dividend Policy
• On November 20, 2019, the Board also established a future dividend policy pursuant to which the Board intends to declare a dividend in each of February, May, August and November in an amount equal to (a) SBLK’s Total Cash Balance minus (b) the product of (i) the Minimum Cash Balance per Vessel and (ii) the Number of Vessels.
• “Total Cash Balance” means (a) the aggregate amount of cash on SBLK’s balance sheet as of the last day of the quarter preceding the relevant dividend declaration date minus (b) any proceeds received by SBLK and its subsidiaries from vessel sales or securities offerings in the last 12 months that have been earmarked for share repurchases, debt prepayment and vessel acquisitions.
• “Minimum Cash Balance per Vessel” means:
A. $1.00 million for December 31, 2019;
B. $1.15 million for March 31, 2020
C. $1.30 million for June 30, 2020
D. $1.45 million for September 30, 2020
E. $1.60 million for December 31, 2020
F. $1.75 million for March 31, 2021
G. $1.90 million for June 30, 2021
H. $2.10 million for September 30, 2021
• “Number of Vessels” means the total number of vessels owned or leased on a bareboat basis by Star Bulk and its subsidiaries as of the last day of the quarter preceding the relevant dividend declaration date.
• Any future dividends remain subject to approval of our Board each quarter, after its review of our financial performance and will depend upon various factors, including but not limited to the prevailing charter market conditions, capital requirements, limitations under our credit agreements and applicable provisions of Marshall Islands law. There can be no assurance that our Board will declare any dividend in the future.
 点击添加图片描述(最多60个字)
Recent Developments
Fleet Update
• In October, 2019, we agreed to sell the Star Cosmo, a 2005 built Supramax vessel and the Star Epsilon, a 2001 built Supramax vessel. We expect to deliver both vessels to their new owners by the end of November. The proceeds from these sales, after prepayment of the debt related to the two vessels, are expected to be approximately $6.0 million and we expect to incur a non-cash loss of approximately $4.5 million in the fourth quarter of 2019.
Scrubber Update
• During Q3 2019 we have completed the installation of 44 scrubber systems, bringing the total number of scrubbers installed to 78, as of September 30, 2019.
• The Company continues to execute on its plan to install scrubbers on 114 out of 116 vessels in its fleet, having installed a total of 88 scrubbers as of November 20, 2019.
Financing Activities
• In October 2019 and November 2019, we drew down an aggregate amount of $106.5 million under the CEXIM $106.5 million Facility, which we entered into in September 2019. The proceeds were used to refinance $101.5 million outstanding under the previous lease agreements of the Katie K, the Debbie H, and the Star Ayesha.
• In September 2019, we entered into a committed term sheet with a major European bank for an amount of up to $30.0 million in order to finance working capital requirements, which remains subject to execution of customary definitive documentation.
Scrubber Financing Activities
• We incurred the following indebtedness to finance our scrubber installation program:
— On August 12, 2019, we drew down $3.3 million under the Attradius Facility.
— In September 2019, we drew down (i) $15.6 million under the DNB $310.0 million Facility, (ii) $1.3 million under the SEB Facility and (iii) $7.6 million under the lease agreements with CMBL.
• Subsequent to September 30, 2019, we drew down (i) another $10.9 million under the DNB $310.0 million Facility, (ii) $1.4 million under the ING Facility and (iii) a further $4.6 million under the lease agreements with CMBL.
• Following these drawdowns, the total drawn amount for scrubber financing is $79.1 million and the remaining available scrubber-related financing under all of our debt and lease agreements is $70.7 million.
Employment update
The below estimated daily TCE rates are provided using the discharge-to-discharge method of accounting, while as per US GAAP we recognize revenues in our books using the load-to-discharge method of accounting. Both methods, recognize the same total TCE revenues over the completion of a voyage, however discharge-to-discharge method recognizes revenues over more days, resulting in lower daily TCE rates. Under the load-to discharge method of accounting, increased ballast days at the end of the quarter will reduce the revenues that can be booked, following the accounting cut-off, in the relevant quarter, resulting in reduced daily TCE rates for the respective period.
As of today, we have fixed employment for approximately 68% of the days in Q4 2019 at average TCE rates of $16,284 per day.
More specifically:
Capesize / Newcastlemax Vessels: approximately 63.7% of Q4 2019 days at $23,599 per day.
Post Panamax / Kamsarmax / Panamax Vessels: approximately 68.3% of Q4 2019 days at $14,064 per day.
Ultramax / Supramax Vessels: approximately 72.6% of Q4 2019 days at $11,743 per day.
Amounts shown throughout the press release and variations in period–on–period comparisons are derived from the actual numbers in our books and records.
Third Quarter 2019 and 2018 Results
Voyage revenues for the third quarter of 2019 increased to $248.4 million from $188.5 million in the third quarter of 2018. Adjusted time charter equivalent revenues (“Adjusted TCE Revenues”) (please see the table at the end of this release for the calculation of the Adjusted TCE Revenues) were $131.0 million for the third quarter of 2019, compared to $129.0 million for the third quarter of 2018. While the average number of vessels in the third quarter of 2019 increased to 116.1 from 98.2 in the third quarter of 2018, the Available days for the third quarter of 2019 were not increased proportionally due to the installation of scrubbers and increased dry docking activity during the third quarter of 2019. The TCE rate for the third quarter of 2019 was $14,688 compared to $14,549 for the third quarter of 2018.
For the third quarter of 2019, operating income was $28.6 million, which includes depreciation of $32.2 million, compared to operating income of $47.5 million for the third quarter of 2018, which included depreciation of $28.8 million. Depreciation increased during the third quarter of 2019 due to a higher average number of vessels in our fleet as described above. Operating income declined in the third quarter of 2019 as compared to the third quarter of 2018, mainly because of higher depreciation expense as well as the significantly higher dry docking expenses also affected by our management’s decision to bring forward to 2019 all the 2020 dry docking services concurrently with the installation of scrubbers in order to avoid any additional off hire days in 2020 due to dry docking.
For the third quarter of 2019, we had a net income of $5.8 million, or $0.06 earnings per share, basic and diluted, based on 94,188,543 weighted average basic shares and 94,276,144 weighted average diluted shares, respectively. Net income for the third quarter of 2018 was $26.1 million, or $0.30 earnings per share, basic and diluted, based on 87,025,267 weighted average basic shares and 87,430,711 weighted average diluted shares, respectively.
Net income for the third quarter of 2019, included the following significant non-cash items, other than depreciation expense mentioned above:
• Unrealized gain on forward freight agreements and bunker swaps of $0.4 million or $0.004 per share, basic and diluted;
• Stock-based compensation expense of $3.5 million, or $0.04 per share, basic and diluted, recognized in connection with common shares granted to our directors and employees; and
• Net amortization of the fair value of below and above market acquired time charters of $0.3 million, or $0.003 per share, basic and diluted, associated with time charters attached to vessels acquired. The respective net amortization was recorded as an increase to voyage revenues.
In addition, as mentioned above, we installed scrubbers on certain of our vessels in the third quarter of 2019. Some of these vessels were due to undergo their scheduled dry docking surveys in 2020. In order to avoid any additional off hire days for these vessels in 2020 due to dry docking, we decided to complete the dry docking survey for these vessels concurrently with the installation of scrubbers in the third quarter of 2019. During the third quarter of 2019, we incurred dry docking expenses of $16.7 million, $8.5 million of which related to accelerated dry dockings due in 2020. During the third quarter of 2019 20 of our vessels completed their periodic dry docking surveys. Dry docking expenses for the third quarter of 2018 were $2.6 million corresponding to three of our vessels that underwent their periodic dry docking surveys.
Net income for the third quarter of 2018, included the following significant non-cash items, other than depreciation expense:
• Stock-based compensation expense of $2.7 million, or $0.03 per share, basic and diluted, recognized in connection with common shares granted to our directors and employees;
• Unrealized loss on forward freight agreements and bunker swaps of $1.3 million, or $0.01 per share, basic and diluted;
• Loss on debt extinguishment $1.4 million, $0.02 per share, basic and diluted, recognized in connection with the refinancing of certain of our debt facilities;
• Unrealized gain on derivative financial instruments of $0.7 million or $0.01 per share and diluted; and
• Amortization of the fair value of below market acquired time charters of $0.7 million, $0.01 per share, basic and diluted, associated with the time charters attached to two vessels acquired during this quarter. The respective amortization was recorded as an increase to voyage revenues.
Adjusted net income for the third quarter of 2019, which excludes certain non-cash items and the accelerated dry docking expenses that were due in 2020 discussed above, was $17.3 million, or $0.18 earnings per share, basic and diluted, compared to adjusted net income of $30.5 million, or $0.35 earnings per share, basic and diluted, for the third quarter of 2018.
Adjusted EBITDA for the third quarter of 2019, which excludes certain non-cash items and the accelerated dry docking expenses that were due in 2020 discussed above, was $72.2 million, compared to $80.1 million for the third quarter of 2018.
For the third quarters of 2019 and 2018, vessel operating expenses were $39.7 million and $36.6 million, respectively. This increase was primarily due to the increase in the average number of vessels to 116.1 from 98.2. Vessel operating expenses for the third quarter of 2019 included pre-delivery and pre-joining expenses of $0.3 million while no such expenses were incurred during the third quarter of 2018. Excluding these expenses, our average daily operating expenses per vessel for the third quarter of 2019 and 2018, were $3,693 and $4,054, respectively.
General and administrative expenses for the third quarters of 2019 and 2018 were $9.7 million and $9.0 million, respectively. Management fees for the third quarters of 2019 and 2018 were $4.6 million and $3.4 million, respectively. The increase is attributable to the new management agreements entered into in connection with the acquired fleets during the third quarter of 2018 and 2019. Our average daily net cash general and administrative expenses per vessel (including management fees) for the third quarter of 2019 were reduced to $828 from $918 during the third quarter of 2018 (please see the table at the end of this release for the calculation of the Average daily Net Cash G&A expenses per vessel).
Charter-in hire expense for the third quarters of 2019 and 2018 was $48.5 million and $27.1 million, respectively. The increase is mainly due to the increase in charter-in days of 2,372 in the third quarter of 2019 compared to 1,511 in the third quarter of 2018. In both quarters, the charter-in days are mainly attributable to the activities of our subsidiary Star Logistics.
For the third quarter of 2019, we incurred a net loss on forward freight agreements and bunker swaps of $0.6 million, consisting of realized loss of $1.0 million and unrealized gain of $0.4 million. For the third quarter of 2018, we incurred a net loss on forward freight agreements and bunker swaps of $1.1 million, consisting of realized gain of $0.2 million and unrealized loss of $1.3 million.
Interest and finance costs net of interest and other income/ (loss) for the third quarters of 2019 and 2018 were $22.5 million and $20.7 million, respectively. The increase is primarily attributable to the increase in the weighted average balance of our outstanding indebtedness of $1,572.5 million during the third quarter of 2019 compared to $1,376.2 million for the same period in 2018.
Nine months ended September 30, 2019 and 2018 Results
Voyage revenues for the nine months ended September 30, 2019 increased to $572.7 million from $442.1 million for the nine months ended September 30, 2018. Adjusted TCE Revenues were $326.7 million for the nine months ended September 30, 2019, compared to $300.9 million for the nine months ended September 30, 2018. Adjusted TCE Revenues were positively impacted by an increase in the average number of vessels in our fleet to 110.2 in the nine months ended September 30, 2019, up from 81.4 in the nine months ended September 30, 2018. The TCE rate for the nine months ended September 30, 2019 was $12,143 compared to $13,691 for the nine months ended September 30, 2018, reflecting the weaker dry bulk market environment in 2019 compared to the same period in 2018.
For the nine months ended September 30, 2019, operating income was $27.5 million, which includes depreciation of $92.0 million. Operating income of $98.0 million for the nine months ended September 30, 2018 included depreciation of $72.0 million. Depreciation increased during the nine months ended September 30, 2019 due to the higher average number of vessels in our fleet as described above. Operating income declined in the nine months ended September 30, 2019 as compared to the nine months ended September 30, 2018, mainly because of higher depreciation expense and higher operating expenses due to the higher average number of vessels in our fleet as well as the significantly higher dry docking expenses as discussed above partially offset by the increase in Adjusted TCE Revenues as discussed above.
For the nine months ended September 30, 2019, we had a net loss of $39.7 million, or $0.43 loss per share, basic and diluted, based on 93,040,799 weighted average basic and diluted shares. Net income for the nine months ended September 30, 2018 was $46.7 million, or $0.65 earnings per share, basic and diluted, based on 71,872,575 weighted average basic shares and 72,206,527 weighted average diluted shares, respectively.
Net loss for the nine months ended September 30, 2019, included the following significant non-cash items, other than depreciation expense mentioned above:
• Unrealized loss on forward freight agreements and bunker swaps of $0.6 million, or $0.01 per share, basic and diluted;
• Stock-based compensation expense of $6.4 million, or $0.07 per share, basic and diluted, recognized in connection with common shares granted to our directors and employees;
• Impairment loss of $3.4 million, or $0.04 per share, basic and diluted, recognized in connection with the agreement to sell the vessels Star Anna and Star Gamma;
• Loss on sale of vessels of $0.8 million, or $0.01 per basic and diluted share in connection with the vessels’ sales that took place during the period;
• Loss on bad debt of $1.3 million or $0.01 per basic and diluted share associated with the write‐off of disputed charterer balances; and
• Net amortization of the fair value of below and above market acquired time charters of $1.5 million, or $0.02 per share, basic and diluted, associated with time charters attached to vessels acquired. The respective net amortization was recorded as an increase to voyage revenues.
In addition, during the nine months ended September 30, 2019, we incurred dry docking expenses of $45.4 million, $19.0 of which relating to accelerated dry dockings due in 2020. During the nine months ended September 30, 2019, 32 of our vessels completed their periodic dry docking surveys. Dry docking expenses for the nine months ended September 30, 2018, were $5.8 million corresponding to five of our vessels that underwent their periodic dry docking surveys.
Net income for the nine months ended September 30, 2018, included the following significant non-cash items, other than depreciation expense:
• Stock-based compensation expense of $7.7 million, or $0.11 per share, basic and diluted, recognized in connection with common shares granted to our directors and employees;
• Unrealized loss on forward freight agreements and bunker swaps of $1.0 million, or $0.01 per share, basic and diluted;
• Loss on debt extinguishment of $1.5 million, or $0.02 per share, basic and diluted, recognized in connection with the refinance of certain of our debt facilities;
• Unrealized gain on derivative financial instruments of $0.7 million, or $0.01 per share, basic and diluted; and
• Amortization of the fair value of below market acquired time charters of $0.7 million, or $0.01 per share, basic and diluted, associated with time charters attached to two vessels acquired. The respective amortization was recorded as an increase to voyage revenues.
• Adjusted net loss for the nine months ended September 30, 2019, which excludes certain non-cash items and the accelerated dry docking expenses that were due in 2020 discussed above, was $9.7 million, or $0.10 loss per share, basic and diluted, compared to adjusted net income of $55.8 million, or $0.78 earnings per share, basic, and $0.77 earnings per share, diluted for the nine months ended September 30, 2018
Adjusted EBITDA for the nine months ended September 30, 2019, which excludes certain non-cash items and the accelerated dry docking expenses that were due in 2020 discussed above, was $149.4 million, compared to $178.5 million for the nine months ended September 30, 2018.
For the nine months ended September 30, 2019 and 2018, vessel operating expenses were $117.9 million and $90.3 million, respectively. This increase was primarily due to the increase in the average number of vessels to 110.2 from 81.4. Vessel operating expenses for the nine months ended September 30, 2019, included pre-delivery and pre-joining expenses of $1.2 million compared to $1.1 million in the same period in 2018. Excluding these expenses, our average daily operating expenses per vessel for the nine months ended September 30, 2019 and 2018, were $3,876 and $4,018, respectively.
General and administrative expenses for the nine months ended September 30, 2019 and 2018 were $26.8 million and $26.7 million, respectively. Management fees for the nine months ended September 30, 2019 and 2018 were $12.8 million and $7.3 million, respectively. The increase is attributable to the new management agreements entered into in connection with the fleets we acquired in the third quarters of 2018 and 2019. Our average daily net cash general and administrative expenses per vessel (including management fees) for the nine months ended September 30, 2019 were reduced to $931 from $1,018 during the nine months ended September 30, 2018 (please see the table at the end of this release for the calculation of the Average daily Net Cash G&A expenses per vessel).
Charter-in hire expense for the nine months ended September 30, 2019 and of 2018 was $93.0 million and $67.9 million, respectively. The increase is due to charter-in days of 5,581 in the nine months ended September 30, 2019 compared to 3,596 in the same period in 2018. In both periods, the charter in days are mainly attributable to the activities of our subsidiary Star Logistics.
For the nine months ended September 30, 2019 we incurred a net gain on forward freight agreements and bunker swaps of $6.8 million, consisting of realized gain of $7.4 million and unrealized loss of $0.6 million. For the nine months ended September 30, 2018 we incurred a net gain on forward freight agreements and bunker swaps of $0.9 million, consisting of unrealized loss of $1.0 million and realized gain of $1.9 million.
Interest and finance costs net of interest and other income/ (loss) for the nine months ended September 30, 2019 and 2018 were $65.2 million and $50.7 million, respectively. The increase is primarily attributable to the increase in the weighted average balance of our outstanding indebtedness of $1,503.5 million during the nine months ended September 30, 2019, compared to $1,162.8 million for the same period in 2018.
Liquidity and Capital Resources
Cash Flows
Net cash provided by operating activities for the nine months ended September 30, 2019 and 2018 was $35.3 million and $109.2 million, respectively.
The reduction was due to the weaker dry bulk market in the nine months ended September 30, 2019 compared to the same period in 2018, which resulted in a lower TCE rate of $12,143 compared to $13,691 for the nine months ended September 30, 2018. Moreover, despite the increase in the average number of vessels in our fleet, the decrease in TCE rates and the increased dry docking activity resulting in $45.4 million expenses (including $19.0 million of expenses related to accelerated dry dockings concurrently with certain of our scrubber installations), caused a decrease of Adjusted EBITDA to $149.4 million for the nine months ended September 30, 2019 from $178.5 million for the corresponding period in 2018. This decrease in Adjusted EBITDA was combined with (i) a net working capital outflow of $34.1 million during the nine months ended September 30, 2019 compared to a net working capital outflow of $16.5 million for the nine months ended September 30, 2018 and (ii) higher net interest expense due to an increase in the average number of vessels in our fleet as well as due to incurrence of debt for scrubbers’ financing for the nine months ended September 30, 2019 compared to the corresponding period in 2018.
Net cash used in investing activities for the nine months ended September 30, 2019 and 2018 was $253.4 million and $271.5 million, respectively.
For the nine months ended September 30, 2019, net cash used in investing activities mainly consisted of:
• $107.7 million paid in connection with the acquisition of secondhand vessels and $95.8 million paid in connection with three newbuilding vessels delivered during the nine months ended September 30, 2019;
• $100.8 million paid for the acquisition and installation of scrubber equipment and ballast water management systems for certain of our vessels;
• offset by:
• $44.2 million of proceeds from the sale of five vessels concluded during the period; and
• $6.7 million of insurance proceeds.
For the nine months ended September 30, 2018, net cash used in investing activities mainly consisted of $273.0 million paid for advances and other capitalized expenses for our newbuilding and newly acquired vessels delivered during the period, offset partially by hull and machinery insurance proceeds of $1.5 million.
Net cash provided by financing activities for the nine months ended September 30, 2019 and 2018 was $121.4 million and $127.0 million, respectively.
For the nine months ended September 30, 2019, net cash provided by financing activities mainly consisted of:
$620.4 million of proceeds from financing transactions including financing from leases;
offset by:
• $468.6 million lease and debt obligations paid in aggregate in connection with: (i) the regular amortization of outstanding vessel financings and finance lease installments, and (ii) early repayment due to the refinancing of certain of our facilities and the sale of vessels;
• $20.5 million used mainly to repurchase our common shares under our previously announced share repurchase program;
• $8.2 million of financing fees paid in connection with the new financing agreements; and
• $1.7 million of prepayment fees paid in connection with early repaid debt due to its refinancing.
For the nine months ended September 30, 2018, net cash provided by financing activities mainly consisted of:
• $710.7 million of proceeds from financing transactions including financing from leases
• offset partially by:
• $576.7 million paid in aggregate in connection with: (i) the regular amortization of outstanding vessel financings and capital lease installments (ii) early repayment due to the refinancing of certain of our facilities (iii) payments under our cash sweep mechanism and (iv) full repayment of deferred debt amounts; and
• $7.7 million of financing fees paid in connection with new debt facilities.
Source: Star Bulk Carriers Corp.


